Articles & Insights

Deep technical articles on imaging technologies, Western blot optimization, and preclinical workflows. Written by Vilber scientists for researchers who care about the data behind the image.

Latest articles

Western blot
Protocol optimization
Article

Western Blot Troubleshooting: How to Diagnose No Bands, Faint Signal, and Common Imaging Issues

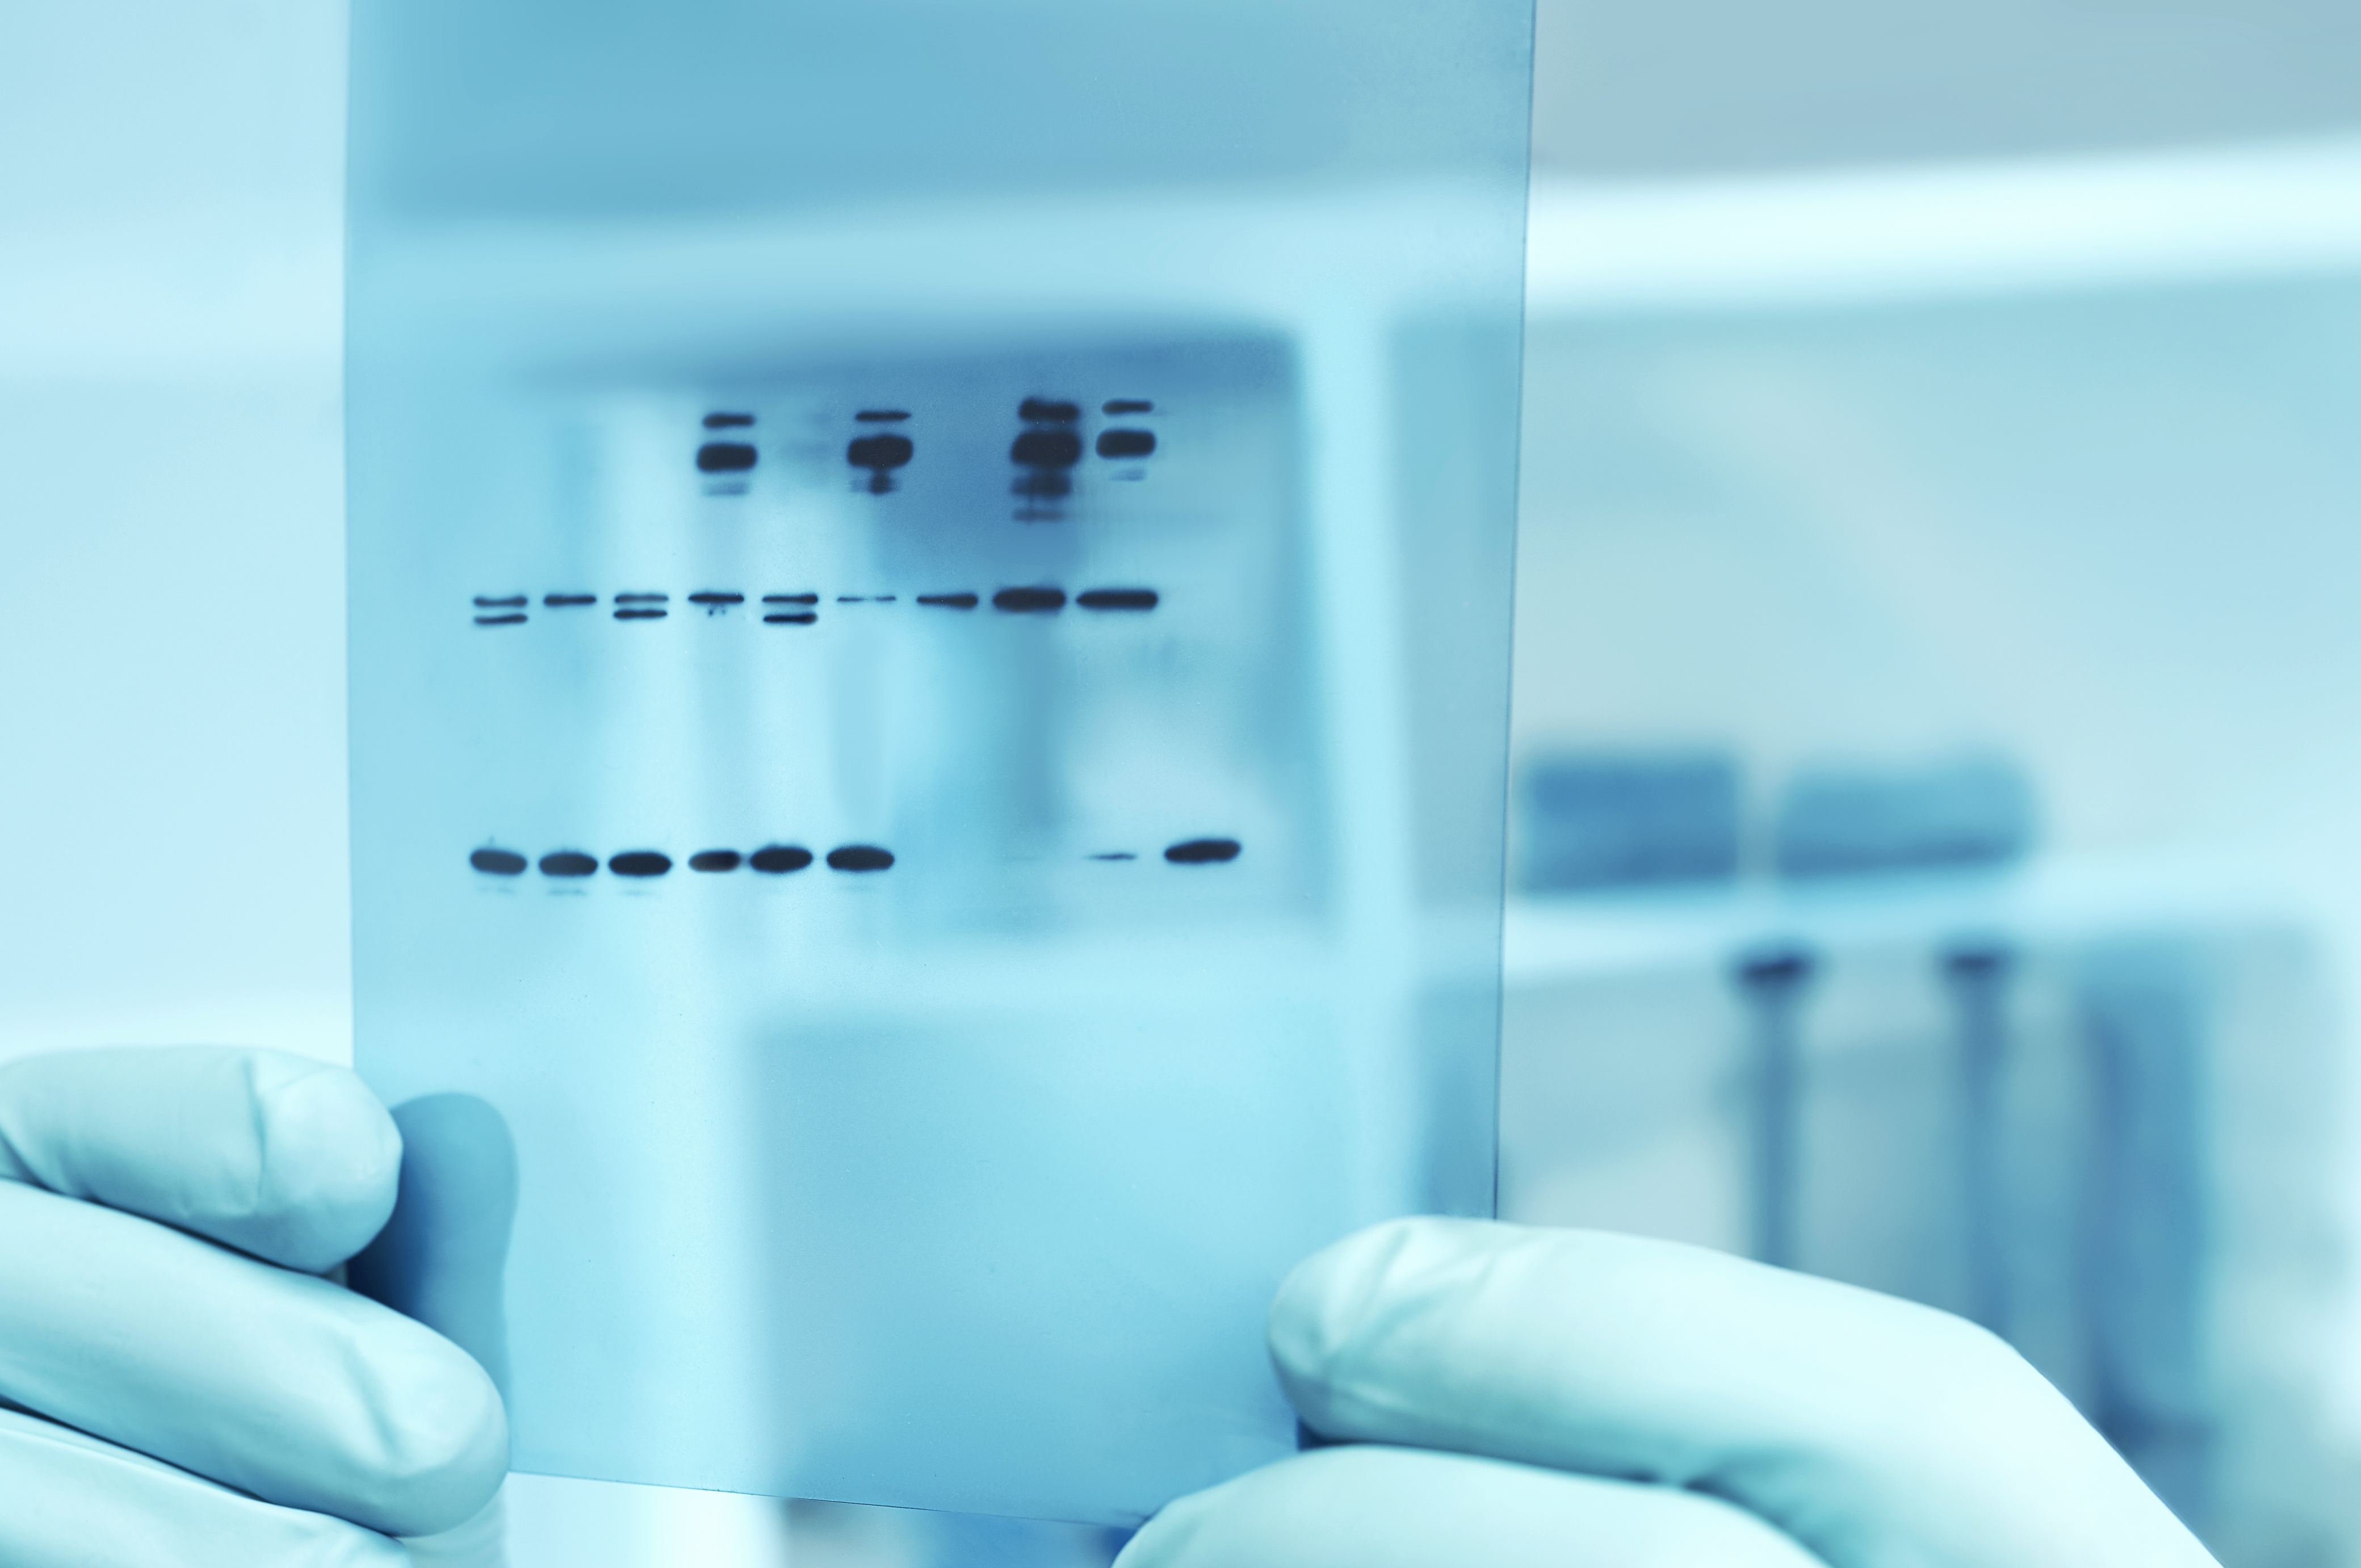
A failed Western blot is one of the most common frustrations in molecular biology labs. You spent the day preparing samples, running the gel, transferring the membrane, incubating antibodies. Then the image comes out wrong: ghost bands, uneven transfer, or a dirty background that masks the target. A blot that took two days to produce cannot be redone quickly, and each failure means lost time, lost sample, and sometimes lost budget. Most Western blot troubleshooting guides focus on the wet chemistry side: which buffer to use, which antibody dilution to try. This guide takes a different angle. It starts from what the imager reveals, because the appearance of the blot on your imaging system is often the clearest diagnostic clue you have. A weak signal has different causes depending on whether the entire membrane is dim or just one lane. A high background can come from the protocol, from contamination, or from the imager itself. Reading the image correctly saves several rounds of protocol adjustments. This article is organized as a visual diagnostic grid. For each symptom you observe on the imager, we explain the most probable causes, how to distinguish them, and how to fix them. It is meant for researchers who already understand the Western blot workflow and want a systematic approach to solving imaging problems.
Ôcéane Merten
18 min read
September 18, 2026
— STAY INFORMED

Scientific imaging insights, monthly.

Practical articles written by Vilber scientists. New techniques, application notes, and product updates. No spam.

By subscribing, you agree to our Privacy Policy. Unsubscribe anytime.

Continue exploring

Thank you! Your submission has been received!
Oops! Something went wrong while submitting the form.
Western blot
Protocol optimization
Article

The Complete Guide to Chemiluminescent Western Blot: ECL Substrates, Protocol, and Imaging Optimization

Chemiluminescent western blotting remains the most sensitive detection method for low-abundance target proteins, and it is still the default approach for many research labs after decades of use. The technique is mature, but the choices that determine whether a chemiluminescent blot produces reliable quantitative data, or just a pretty image, have shifted as ECL substrates, transfer technologies, and scientific imagers have evolved. Optimizing each step of the ECL western blot protocol matters because the gap between publishable and ambiguous results often comes down to substrate grade, exposure timing, and imager configuration rather than the antibody itself. An ECL western blot protocol consists of membrane blocking, primary antibody incubation, washing, horseradish peroxidase-conjugated secondary antibody incubation, substrate application, and digital image acquisition. Each step affects the final signal quality and quantitative accuracy. Understanding how these steps interact explains why the same antibody can produce clean publishable data on one blot and ambiguous results on another. This guide covers the modern chemiluminescent Western blot workflow from substrate selection to image acquisition. It is intended for researchers who already understand the basics of the technique and want to optimize each step for sensitivity, reproducibility, and quantification. The protocols and parameters below come from application work with research labs and from the technical specifications of the modern imaging platforms used in the field.
Tristan Fromager
19 min read
August 28, 2026
Western blot
Quantification
Article

How to Analyze and Quantify Western Blot Results: From Imaging to Statistical Analysis

A Western blot is only as good as the analysis that follows. The same membrane, the same antibodies, and the same acquisition can produce very different conclusions depending on how the bands are read, how the intensities are measured, and how the data is reported. This guide walks through the modern workflow for analyzing and quantifying Western blot results, from band identification to statistical analysis, with the specific decisions that distinguish publishable data from data that gets returned by reviewers. The protocol below covers reading the blot, interpreting band intensity, configuring the image acquisition for quantitative analysis, choosing between densitometry tools, understanding the difference between relative and absolute quantification, applying appropriate statistical methods, and troubleshooting common quantification issues. It reflects the techniques used by application specialists at Vilber and the workflows enabled by the Evolution software running on modern scientific imagers. This guide is written for life scientists who perform traditional western blotting as part of their research workflow: graduate students and postdocs learning how to analyze western blot results for the first time, as well as experienced technicians and lab managers who need to move from visual interpretation to quantitative western blot analysis that meets publication standards. The detection process covers all sample types, from cell lysate prepared from cultured cells to protein lysate extracted from tissue, and applies to any particular protein target regardless of molecular biology application.
Tristan Fromager
18 min read
August 21, 2026